Chinese
- REPORT SUMMARY
- TABLE OF CONTENTS
-
The rotary indexer has the remarkable characteristics of large transmission torque, high positioning accuracy, stable high-speed operation, self-locking positioning, and low noise. The rotary index plate is an ideal substitute for the Geneva mechanism, no gear mechanism, ratchet mechanism and other traditional intermittent structures.
Surge in Market Value
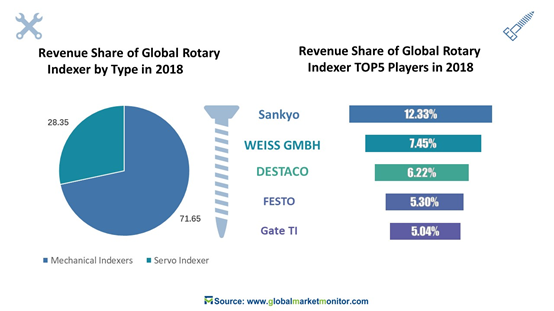
There are two types of rotary indexers, one is a mechanical indexer and the other is a servo indexer. Among them, mechanical indexers accounted for 71.65%, and servo indexers accounted for 28.35%.In 2017 alone, the revenue of mechanical indexers reached 492.61 million U.S. dollars, while the revenue of servo indexers was 194.91 million U.S. dollars.
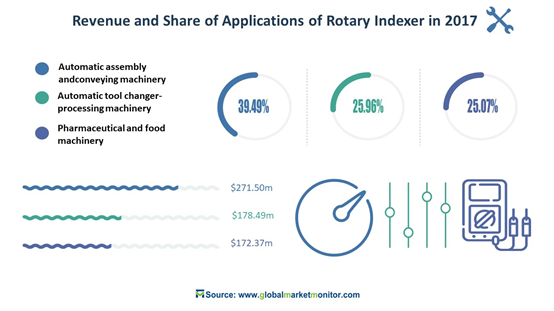
Rotary indexers are mainly used in three areas, pharmaceutical and food industries, automatic assembly and conveying machinery, and automatic tool changer-processing machines. Among them, the rotary indexer of automatic assembly and conveying machinery has the largest revenue, reaching 28529 million US dollars in 2018, accounting for 39.49% of the entire rotary indexer market revenue. The revenue of rotary indexers in the pharmaceutical and food industries and automatic tool changer-processing machines were $182.21m and $197.35m, respectively, accounting for 25.07% and 25.96% of market revenue.
After the outbreak of the COVID-19 epidemic, the pharmaceutical industry has become popular, and the demand for indexers in the pharmaceutical industry has soared, and the requirements have also increased.
Global Revenue Increased, Growth Rate slowed
From the perspective of the global market, the revenue of rotary indexers continues to climb, and is expected to reach $656.67m in 2025, with a compound annual growth rate of 2.74%. In 2017, the market revenue of rotary indexers was $
687.52 million, an annual growth rate of 5% to 6%. Although the market value continues to rise, the growth rate is slowly falling.
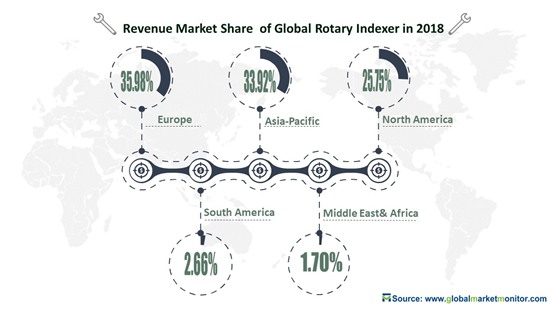
In addition to the United States, Japan, and Canada, the eight major industrial countries in the world are all located in Europe, which promotes the development of European industry. Therefore, the European indexer market is also a global leader, accounting for 35.98% of the global market. With Japan's strong industrial productivity and excellent quality, and the huge consumption power of Southeast Asian countries, Asia-Pacific has become a region second only to Europe, accounting for 33.92% of the global market. At present, Asia is the largest demand market and manufacturing base for indexing disks in the world. India is a major producer of traditional mechanical indexing devices. For China's mid-to-high-end indexing device production, China have a large market share, while Japan mainly produces high-end digital indexing devices. The epidemic has severely hit European industries. Asia-Pacific, which has relatively little losses, is expected to surpass Europe after the epidemic and become the world's largest area of rotary indexing revenue.
The United States is the world's largest economy, with highly developed industries, huge production scale, complete structure, and advanced technology. Canada's furniture and pharmaceutical industries are world-renowned. With these two countries, North America's market share is not small, at 25.75%. Compared with these three regions, the market shares of South America and the Middle East are negligibly small, 2.66% and 1.70% respectively. However, there are still a few countries in these two regions that have performed very well. Brazil, which is eager to improve its infrastructure, has imported a large number of rotary indexers in the past few years, and its revenue accounted for 60.31% of the entire South American region. Among South Africa's four major economic pillars, mining, manufacturing, agriculture and service industries, only mining and manufacturing require a large number of rotary indexers. South Africa accounts for 50.30% of the revenue of rotary indexers in the Middle East and Africa.
Market Downturn, Demand Improvement
The continuous silence of the market makes it more and more difficult to compete in the indexer market. Many manufacturers say that the market is difficult to do, mainly because of four points. The indexer market is gradually saturated, the market demand is gradually decreasing, and the phenomenon of oversupply is gradually showing; Affected by the market economy, prices have risen, consumer income has been relatively reduced, and consumer consumption has increased. They are more cautious in product requirements and choices; The negative impact of the price war, with the increase in market competitiveness, low prices have become a weapon of manufacturers, so benefits continue to decrease, resulting in a decline in profits; Capital turnover is not flexible. Due to the high market competition and the long circulation cycle of indexer funds, manufacturers cannot withdraw funds in a timely manner, resulting in high pressure on indexer manufacturers.
The first big mountain facing the indexer industry is the high cost. In order to meet the increasingly demanding consumer needs of users and improve user experience, indexer manufacturers need to continuously improve technology and quality. In the trend of industrial development, manufacturers like the indexer industry will not go too far in the market if they rely on copying their products. Because technology and quality cannot be replicated, the development of the automation industry has higher and higher requirements for the quality of indexers. Only technology and innovation are important factors to win the market.
From the perspective of brand development, it is necessary to strengthen the maintenance of the intellectual property rights of its own products. Most of the high-quality indexer industry is self-developed and self-innovated high-precision products, and strive for survival by quality. When there is a need for manufacturers to choose the indexer,they must look for the indexer market. Low prices are important in the industry, but only high-precision, long-life, high-quality products can bring greater benefits to the enterprise.
Sankyo, in Japan, is the most technologically advanced index plate manufacturer in the world. Germany WEISS GMBH is the most profitable index plate manufacturer in recent years. The United States' DESTACO and Germany's FETSO ranked third and fourth. As the market has not changed much, the market ranking has remained almost unchanged in recent years.
Table of Contents
1 Report Overview
-
1.1 Product Definition and Scope
-
1.2 PEST (Political, Economic, Social and Technological) Analysis of Rotary Indexer Market
-
1.3 Market Segmentation by Type
-
1.3.1 Global Rotary Indexer Market Share by Types
-
1.3.1 Global Rotary Indexer Market Size and Growth Rate of Heavy-duty Rotary Indexer from 2014 to 2026
-
1.3.2 Global Rotary Indexer Market Size and Growth Rate of Light-load Rotary Indexer from 2014 to 2026
-
1.4 Market Segmentation by End-Users
-
1.4.1 Global Rotary Indexer Market Share by End-Users
-
1.4.1 Global Rotary Indexer Market Size and Growth Rate of Automatic assembly and conveying machinery from 2014 to 2026
-
1.4.2 Global Rotary Indexer Market Size and Growth Rate of Pharmaceutical and food machinery from 2014 to 2026
-
1.4.3 Global Rotary Indexer Market Size and Growth Rate of Automatic tool changer - processing machine from 2014 to 2026
-
1.4.4 Global Rotary Indexer Market Size and Growth Rate of Other from 2014 to 2026
-
1.5 Market Segmentation by Regions
-
1.5.1 North America Rotary Indexer Market Size and Growth Rate from 2014 to 2026
-
1.5.1.1 United States Rotary Indexer Market Size and Growth Rate from 2014 to 2026
-
1.5.1.2 Canada Rotary Indexer Market Size and Growth Rate from 2014 to 2026
-
1.5.1.3 Mexico Rotary Indexer Market Size and Growth Rate from 2014 to 2026
-
1.5.2 Europe Rotary Indexer Market Size and Growth Rate from 2014 to 2026
-
1.5.2.1 Germany Rotary Indexer Market Size and Growth Rate from 2014 to 2026
-
1.5.2.2 UK Rotary Indexer Market Size and Growth Rate from 2014 to 2026
-
1.5.2.3 France Rotary Indexer Market Size and Growth Rate from 2014 to 2026
-
1.5.2.4 Italy Rotary Indexer Market Size and Growth Rate from 2014 to 2026
-
1.5.2.5 Nordic Countries Rotary Indexer Market Size and Growth Rate from 2014 to 2026
-
1.5.2.6 Spain Rotary Indexer Market Size and Growth Rate from 2014 to 2026
-
1.5.2.7 Belgium Rotary Indexer Market Size and Growth Rate from 2014 to 2026
-
1.5.2.8 Poland Rotary Indexer Market Size and Growth Rate from 2014 to 2026
-
1.5.2.9 Russia Rotary Indexer Market Size and Growth Rate from 2014 to 2026
-
1.5.2.10 Turkey Rotary Indexer Market Size and Growth Rate from 2014 to 2026
-
1.5.3 Asia-Pacific Rotary Indexer Market Size and Growth Rate from 2014 to 2026
-
1.5.3.1 China Rotary Indexer Market Size and Growth Rate from 2014 to 2026
-
1.5.3.2 Japan Rotary Indexer Market Size and Growth Rate from 2014 to 2026
-
1.5.3.3 Australia and New Zealand Rotary Indexer Market Size and Growth Rate from 2014 to 2026
-
1.5.3.4 India Rotary Indexer Market Size and Growth Rate from 2014 to 2026
-
1.5.3.5 ASEAN Countries Rotary Indexer Market Size and Growth Rate from 2014 to 2026
-
1.5.3.6 South Korea Rotary Indexer Market Size and Growth Rate from 2014 to 2026
-
1.5.4 Latin America, Middle East & Africa Rotary Indexer Market Size and Growth Rate from 2014 to 2026
-
1.5.4.1 GCC Countries Rotary Indexer Market Size and Growth Rate from 2014 to 2026
-
1.5.4.2 Brazil Rotary Indexer Market Size and Growth Rate from 2014 to 2026
-
1.5.4.3 Nigeria Rotary Indexer Market Size and Growth Rate from 2014 to 2026
-
1.5.4.4 South Africa Rotary Indexer Market Size and Growth Rate from 2014 to 2026
-
1.5.4.5 Argentina Rotary Indexer Market Size and Growth Rate from 2014 to 2026
2 Market Trends and Competitive Landscape
-
2.1 Market Trends and Dynamics
-
2.1.1 Market Challenges and Restraints
-
2.1.2 Market Opportunities and Potentials
-
2.1.3 Mergers and Acquisitions
-
2.2 Competitive Landscape Analysis
-
2.2.1 Industrial Concentration Analysis
-
2.2.2 Porter's Five Forces Analysis of the Industry
-
2.2.3 SWOT Analysis for New Entrants
3 Segmentation of Rotary Indexer Market by Types
-
3.1 Product Development Trends of Different Types
-
3.2 Commercial Product Types of Major Vendors
-
3.3 Competitive Landscape Analysis of Different Types
-
3.4 Market Size of Rotary Indexer by Major Types
-
3.3.1 Rotary Indexer Market Size and Growth Rate of Heavy-duty Rotary Indexer
-
3.3.2 Rotary Indexer Market Size and Growth Rate of Light-load Rotary Indexer
4 Segmentation of Rotary Indexer Market by End-Users
-
4.1 Downstream Client Analysis by End-Users
-
4.2 Competitive Landscape Analysis of Different End-Users
-
4.3 Market Potential Analysis of Different End-Users
-
4.4 Market Size of Rotary Indexer by Major End-Users
-
4.3.1 Market Size and Growth Rate of Rotary Indexer in Automatic assembly and conveying machinery
-
4.3.2 Market Size and Growth Rate of Rotary Indexer in Pharmaceutical and food machinery
-
4.3.3 Market Size and Growth Rate of Rotary Indexer in Automatic tool changer - processing machine
-
4.3.4 Market Size and Growth Rate of Rotary Indexer in Other
5 Market Analysis by Major Regions
-
5.1 Global Rotary Indexer Production Analysis by Major Regions
-
5.2 Global Rotary Indexer Consumption Analysis by Major Regions
-
5.3 Global Rotary Indexer Production, Import, Consumption and Export Analysis by Regions
-
5.3.1 North America Rotary Indexer Production, Import, Consumption and Export Analysis
-
5.3.2 Europe Rotary Indexer Production, Import, Consumption and Export Analysis
-
5.3.3 Asia Pacific Rotary Indexer Production, Import, Consumption and Export Analysis
-
5.3.4 Latin America, Middle East & Africa Rotary Indexer Production, Import, Consumption and Export Analysis
6 Product Commodity of Rotary Indexer Market in Major Countries
-
6.1 Top 5 Export Countries in Rotary Indexer market from 2014 to 2019
-
6.1.1 Top 5 Export Countries' Export Value Analysis in Rotary Indexer market from 2014 to 2019
-
6.1.2 Top 5 Export Countries' Export Volume Analysis in Rotary Indexer market from 2014 to 2019
-
6.2 Top 5 Import Countries in Rotary Indexer market from 2014 to 2019
-
6.2.1 Top 5 Import Countries' Import Value Analysis in Rotary Indexer market from 2014 to 2019
-
6.2.2 Top 5 Import Countries' Import Volume Analysis in Rotary Indexer market from 2014 to 2019
-
6.3 Emerging Top 3 Export Countries Analysis
-
6.4 Emerging Top 3 Import Countries Analysis
7 North America Rotary Indexer Landscape Analysis
-
7.1 North America Rotary Indexer Landscape Analysis by Major Types
-
7.2 North America Rotary Indexer Landscape Analysis by Major End-Users
-
7.3 North America Rotary Indexer Landscape Analysis by Major Countries
-
7.3.1 United States Rotary Indexer Market Volume and Growth Rate
-
7.3.2 Canada Rotary Indexer Market Volume and Growth Rate
-
7.3.3 Mexico Rotary Indexer Market Volume and Growth Rate
8 Europe Rotary Indexer Landscape Analysis
-
8.1 Europe Rotary Indexer Landscape Analysis by Major Types
-
8.2 Europe Rotary Indexer Landscape Analysis by Major End-Users
-
8.3 Europe Rotary Indexer Landscape Analysis by Major Countries
-
8.3.1 Germany Rotary Indexer Market Volume and Growth Rate
-
8.3.2 UK Rotary Indexer Market Volume and Growth Rate
-
8.3.3 France Rotary Indexer Market Volume and Growth Rate
-
8.3.4 Italy Rotary Indexer Market Volume and Growth Rate
-
8.3.5 Nordic Countries Rotary Indexer Market Volume and Growth Rate
-
8.3.6 Spain Rotary Indexer Market Volume and Growth Rate
-
8.3.7 Belgium Rotary Indexer Market Volume and Growth Rate
-
8.3.8 Poland Rotary Indexer Market Volume and Growth Rate
-
8.3.9 Russia Rotary Indexer Market Volume and Growth Rate
-
8.3.10 Turkey Rotary Indexer Market Volume and Growth Rate
9 Asia Pacific Rotary Indexer Landscape Analysis
-
9.1 Asia Pacific Rotary Indexer Landscape Analysis by Major Types
-
9.2 Asia Pacific Rotary Indexer Landscape Analysis by Major End-Users
-
9.3 Asia Pacific Rotary Indexer Landscape Analysis by Major Countries
-
9.3.1 China Rotary Indexer Market Volume and Growth Rate
-
9.3.2 Japan Rotary Indexer Market Volume and Growth Rate
-
9.3.3 Australia and New Zealand Rotary Indexer Market Volume and Growth Rate
-
9.3.4 India Rotary Indexer Market Volume and Growth Rate
-
9.3.5 ASEAN Countries Rotary Indexer Market Volume and Growth Rate
-
9.3.6 South Korea Rotary Indexer Market Volume and Growth Rate
10 Latin America, Middle East & Africa Rotary Indexer Landscape Analysis
-
10.1 Latin America, Middle East & Africa Rotary Indexer Landscape Analysis by Major Types
-
10.2 Latin America, Middle East & Africa Rotary Indexer Landscape Analysis by Major End-Users
-
10.3 Latin America, Middle East & Africa Rotary Indexer Landscape Analysis by Major Countries
-
10.3.1 GCC Countries Rotary Indexer Market Volume and Growth Rate
-
10.3.2 Brazil Rotary Indexer Market Volume and Growth Rate
-
10.3.3 Nigeria Rotary Indexer Market Volume and Growth Rate
-
10.3.4 South Africa Rotary Indexer Market Volume and Growth Rate
-
10.3.5 Argentina Rotary Indexer Market Volume and Growth Rate
11 Major Players Profile
-
11.1 Weiss
-
11.1.1 Weiss Company Profile and Recent Development
-
11.1.2 Market Performance
-
11.1.3 Product and Service Introduction
-
11.2 DE-STA-CO
-
11.2.1 DE-STA-CO Company Profile and Recent Development
-
11.2.2 Market Performance
-
11.2.3 Product and Service Introduction
-
11.3 Sankyo
-
11.3.1 Sankyo Company Profile and Recent Development
-
11.3.2 Market Performance
-
11.3.3 Product and Service Introduction
-
11.4 CDS
-
11.4.1 CDS Company Profile and Recent Development
-
11.4.2 Market Performance
-
11.4.3 Product and Service Introduction
-
11.5 TanTzu
-
11.5.1 TanTzu Company Profile and Recent Development
-
11.5.2 Market Performance
-
11.5.3 Product and Service Introduction
-
11.6 DEX
-
11.6.1 DEX Company Profile and Recent Development
-
11.6.2 Market Performance
-
11.6.3 Product and Service Introduction
-
11.7 Handex
-
11.7.1 Handex Company Profile and Recent Development
-
11.7.2 Market Performance
-
11.7.3 Product and Service Introduction
-
11.8 ZZ-ANTRIEBE
-
11.8.1 ZZ-ANTRIEBE Company Profile and Recent Development
-
11.8.2 Market Performance
-
11.8.3 Product and Service Introduction
-
11.9 Camdex
-
11.9.1 Camdex Company Profile and Recent Development
-
11.9.2 Market Performance
-
11.9.3 Product and Service Introduction
-
11.10 GSD Cam
-
11.10.1 GSD Cam Company Profile and Recent Development
-
11.10.2 Market Performance
-
11.10.3 Product and Service Introduction
-
11.11 ENTRUST
-
11.11.1 ENTRUST Company Profile and Recent Development
-
11.11.2 Market Performance
-
11.11.3 Product and Service Introduction
-
11.12 CKD
-
11.12.1 CKD Company Profile and Recent Development
-
11.12.2 Market Performance
-
11.12.3 Product and Service Introduction
-
11.13 Taktomat
-
11.13.1 Taktomat Company Profile and Recent Development
-
11.13.2 Market Performance
-
11.13.3 Product and Service Introduction
-
11.14 SOPAP Automation
-
11.14.1 SOPAP Automation Company Profile and Recent Development
-
11.14.2 Market Performance
-
11.14.3 Product and Service Introduction
-
11.15 OGP
-
11.15.1 OGP Company Profile and Recent Development
-
11.15.2 Market Performance
-
11.15.3 Product and Service Introduction
-
11.16 Colombo Filippetti
-
11.16.1 Colombo Filippetti Company Profile and Recent Development
-
11.16.2 Market Performance
-
11.16.3 Product and Service Introduction
-
11.17 Kamoseiko
-
11.17.1 Kamoseiko Company Profile and Recent Development
-
11.17.2 Market Performance
-
11.17.3 Product and Service Introduction
-
11.18 RNA
-
11.18.1 RNA Company Profile and Recent Development
-
11.18.2 Market Performance
-
11.18.3 Product and Service Introduction
-
11.19 Shandong Hongbang
-
11.19.1 Shandong Hongbang Company Profile and Recent Development
-
11.19.2 Market Performance
-
11.19.3 Product and Service Introduction
-
11.20 AUTOROTOR
-
11.20.1 AUTOROTOR Company Profile and Recent Development
-
11.20.2 Market Performance
-
11.20.3 Product and Service Introduction
-
11.21 Huachi Cam
-
11.21.1 Huachi Cam Company Profile and Recent Development
-
11.21.2 Market Performance
-
11.21.3 Product and Service Introduction
-
11.22 Furuta
-
11.22.1 Furuta Company Profile and Recent Development
-
11.22.2 Market Performance
-
11.22.3 Product and Service Introduction
-
11.23 ITALPLANT
-
11.23.1 ITALPLANT Company Profile and Recent Development
-
11.23.2 Market Performance
-
11.23.3 Product and Service Introduction
12 Data Source and Research Methodology
The List of Tables and Figures (Totals 101 Figures and 136 Tables)
-
Figure Product Picture
-
Figure Rotary Indexer Market Size and Growth Rate of Heavy-duty Rotary Indexer from 2014 to 2026
-
Figure Rotary Indexer Market Size and Growth Rate of Light-load Rotary Indexer from 2014 to 2026
-
Figure Market Share by Type in 2014
-
Figure Market Share by Type in 2018
-
Figure Market Share by Type in 2026
-
Figure Global Rotary Indexer Market Size and Growth Rate of Automatic assembly and conveying machinery from 2014 to 2026
-
Figure Global Rotary Indexer Market Size and Growth Rate of Pharmaceutical and food machinery from 2014 to 2026
-
Figure Global Rotary Indexer Market Size and Growth Rate of Automatic tool changer - processing machine from 2014 to 2026
-
Figure Global Rotary Indexer Market Size and Growth Rate of Other from 2014 to 2026
-
Figure Market Share by End-User in 2014
-
Figure Market Share by End-User in 2018
-
Figure Market Share by End-User in 2026
-
Figure North America Rotary Indexer Consumption Market Size and Growth Rate from 2014 to 2026
-
Figure United States Rotary Indexer Consumption Market Size and Growth Rate from 2014 to 2026
-
Figure Canada Rotary Indexer Consumption Market Size and Growth Rate from 2014 to 2026
-
Figure Mexico Rotary Indexer Consumption Market Size and Growth Rate from 2014 to 2026
-
Figure Europe Rotary Indexer Consumption Market Size and Growth Rate from 2014 to 2026
-
Figure Germany Rotary Indexer Consumption Market Size and Growth Rate from 2014 to 2026
-
Figure UK Rotary Indexer Consumption Market Size and Growth Rate from 2014 to 2026
-
Figure France Rotary Indexer Consumption Market Size and Growth Rate from 2014 to 2026
-
Figure Italy Rotary Indexer Consumption Market Size and Growth Rate from 2014 to 2026
-
Figure Nordic Countries Rotary Indexer Consumption Market Size and Growth Rate from 2014 to 2026
-
Figure Spain Rotary Indexer Consumption Market Size and Growth Rate from 2014 to 2026
-
Figure Belgium Rotary Indexer Consumption Market Size and Growth Rate from 2014 to 2026
-
Figure Poland Rotary Indexer Consumption Market Size and Growth Rate from 2014 to 2026
-
Figure Russia Rotary Indexer Consumption Market Size and Growth Rate from 2014 to 2026
-
Figure Turkey Rotary Indexer Consumption Market Size and Growth Rate from 2014 to 2026
-
Figure Asia-Pacific Rotary Indexer Consumption Market Size and Growth Rate from 2014 to 2026
-
Figure China Rotary Indexer Consumption Market Size and Growth Rate from 2014 to 2026
-
Figure Japan Rotary Indexer Consumption Market Size and Growth Rate from 2014 to 2026
-
Figure Australia and New Zealand Rotary Indexer Consumption Market Size and Growth Rate from 2014 to 2026
-
Figure India Rotary Indexer Consumption Market Size and Growth Rate from 2014 to 2026
-
Figure ASEAN Countries Rotary Indexer Consumption Market Size and Growth Rate from 2014 to 2026
-
Figure South Korea Rotary Indexer Consumption Market Size and Growth Rate from 2014 to 2026
-
Figure Latin America, Middle East & Africa Rotary Indexer Consumption Market Size and Growth Rate from 2014 to 2026
-
Figure GCC Countries Rotary Indexer Consumption Market Size and Growth Rate from 2014 to 2026
-
Figure Brazil Rotary Indexer Consumption Market Size and Growth Rate from 2014 to 2026
-
Figure Nigeria Rotary Indexer Consumption Market Size and Growth Rate from 2014 to 2026
-
Figure South Africa Rotary Indexer Consumption Market Size and Growth Rate from 2014 to 2026
-
Figure Argentina Rotary Indexer Consumption Market Size and Growth Rate from 2014 to 2026
-
Figure Development Trends and Industry Dynamics of Rotary Indexer Industry
-
Figure Market Challenges and Restraints
-
Figure Market Opportunities and Potentials
-
Table Mergers and Acquisition
-
Figure Market Share of TOP 3 Players in 2018
-
Figure Market Share of TOP 5 Players in 2018
-
Figure Market Share of TOP 6 Players from 2014 to 2019
-
Figure Porter's Five Forces Analysis
-
Figure New Entrant SWOT Analysis
-
Table Specifications of Different Types of Rotary Indexer
-
Figure Development Trends of Different Types
-
Table Commercial Products Types of Major Vendors
-
Figure Competitive Landscape Analysis of Different Types
-
Table Consumption of Rotary Indexer by Different Types from 2014 to 2026
-
Table Consumption Share of Rotary Indexer by Different Types from 2014 to 2026
-
Figure Market Size and Growth Rate of Heavy-duty Rotary Indexer
-
Figure Market Size and Growth Rate of Light-load Rotary Indexer
-
Table Downstream Client Analysis by End-Users
-
Figure Competitive Landscape Analysis of Different End-Users
-
Table Market Potential Analysis of Different End-Users
-
Table Consumption of Rotary Indexer by Different End-Users from 2014 to 2026
-
Table Consumption Share of Rotary Indexer by Different End-Users from 2014 to 2026
-
Figure Market Size and Growth Rate of Automatic assembly and conveying machinery
-
Figure Market Size and Growth Rate of Pharmaceutical and food machinery
-
Figure Market Size and Growth Rate of Automatic tool changer - processing machine
-
Figure Market Size and Growth Rate of Other
-
Table Global Rotary Indexer Production by Major Regions
-
Table Global Rotary Indexer Production Share by Major Regions
-
Figure Global Rotary Indexer Production Share by Major Regions in 2014
-
Figure Global Rotary Indexer Production Share by Major Regions in 2018
-
Figure Global Rotary Indexer Production Share by Major Regions in 2026
-
Table Global Rotary Indexer Consumption by Major Regions
-
Table Global Rotary Indexer Consumption Share by Major Regions
-
Figure Global Rotary Indexer Consumption Share by Major Regions in 2014
-
Figure Global Rotary Indexer Consumption Share by Major Regions in 2018
-
Figure Global Rotary Indexer Consumption Share by Major Regions in 2026
-
Table North America Rotary Indexer Production, Import, Consumption and Export Analysis
-
Table Europe Rotary Indexer Production, Import, Consumption and Export Analysis
-
Table Asia Pacific Rotary Indexer Production, Import, Consumption and Export Analysis
-
Table Latin America, Middle East & Africa Rotary Indexer Production, Import, Consumption and Export Analysis
-
Table Top 5 Export Countries' Export Value Analysis in Rotary Indexer market from 2014 to 2019
-
Table Top 5 Export Countries' Export Volume Analysis in Rotary Indexer market from 2014 to 2019
-
Table Top 5 Import Countries' Import Value Analysis in Rotary Indexer market from 2014 to 2019
-
Table Top 5 Import Countries' Import Volume Analysis in Rotary Indexer market from 2014 to 2019
-
Figure Emerging Top 3 Export Countries Analysis
-
Figure Emerging Top 3 Import Countries Analysis
-
Table North America Rotary Indexer Consumption by Types from 2014 to 2026
-
Table North America Rotary Indexer Consumption Share by Types from 2014 to 2026
-
Figure North America Rotary Indexer Consumption Share by Types in 2014
-
Figure North America Rotary Indexer Consumption Share by Types in 2018
-
Figure North America Rotary Indexer Consumption Share by Types in 2026
-
Table North America Rotary Indexer Consumption by End-Users from 2014 to 2026
-
Table North America Rotary Indexer Consumption Share by End-Users from 2014 to 2026
-
Figure North America Rotary Indexer Consumption Share by End-Users in 2014
-
Figure North America Rotary Indexer Consumption Share by End-Users in 2018
-
Figure North America Rotary Indexer Consumption Share by End-Users in 2026
-
Table North America Rotary Indexer Consumption by Major Countries from 2014 to 2026
-
Table North America Rotary Indexer Consumption Share by Major Countries from 2014 to 2026
-
Figure North America Rotary Indexer Consumption Share by Major Countries in 2014
-
Figure North America Rotary Indexer Consumption Share by Major Countries in 2018
-
Figure North America Rotary Indexer Consumption Share by Major Countries in 2026
-
Figure United States Rotary Indexer Market Volume and Growth Rate from 2014 to 2026
-
Figure Canada Rotary Indexer Market Volume and Growth Rate from 2014 to 2026
-
Figure Mexico Rotary Indexer Market Volume and Growth Rate from 2014 to 2026
-
Table Europe Rotary Indexer Consumption by Types from 2014 to 2026
-
Table Europe Rotary Indexer Consumption Share by Types from 2014 to 2026
-
Figure Europe Rotary Indexer Consumption Share by Types in 2014
-
Figure Europe Rotary Indexer Consumption Share by Types in 2018
-
Figure Europe Rotary Indexer Consumption Share by Types in 2026
-
Table Europe Rotary Indexer Consumption by End-Users from 2014 to 2026
-
Table Europe Rotary Indexer Consumption Share by End-Users from 2014 to 2026
-
Figure Europe Rotary Indexer Consumption Share by End-Users in 2014
-
Figure Europe Rotary Indexer Consumption Share by End-Users in 2018
-
Figure Europe Rotary Indexer Consumption Share by End-Users in 2026
-
Table Europe Rotary Indexer Consumption by Major Countries from 2014 to 2026
-
Table Europe Rotary Indexer Consumption Share by Major Countries from 2014 to 2026
-
Figure Europe Rotary Indexer Consumption Share by Major Countries in 2014
-
Figure Europe Rotary Indexer Consumption Share by Major Countries in 2018
-
Figure Europe Rotary Indexer Consumption Share by Major Countries in 2026
-
Figure Germany Rotary Indexer Market Volume and Growth Rate from 2014 to 2026
-
Figure UK Rotary Indexer Market Volume and Growth Rate from 2014 to 2026
-
Figure France Rotary Indexer Market Volume and Growth Rate from 2014 to 2026
-
Figure Italy Rotary Indexer Market Volume and Growth Rate from 2014 to 2026
-
Figure Nordic Countries Rotary Indexer Market Volume and Growth Rate from 2014 to 2026
-
Figure Belgium Rotary Indexer Market Volume and Growth Rate from 2014 to 2026
-
Figure Poland Rotary Indexer Market Volume and Growth Rate from 2014 to 2026
-
Figure Russia Rotary Indexer Market Volume and Growth Rate from 2014 to 2026
-
Figure Turkey Rotary Indexer Market Volume and Growth Rate from 2014 to 2026
-
Table Asia Pacific Rotary Indexer Consumption by Types from 2014 to 2026
-
Table Asia Pacific Rotary Indexer Consumption Share by Types from 2014 to 2026
-
Figure Asia Pacific Rotary Indexer Consumption Share by Types in 2014
-
Figure Asia Pacific Rotary Indexer Consumption Share by Types in 2018
-
Figure Asia Pacific Rotary Indexer Consumption Share by Types in 2026
-
Table Asia Pacific Rotary Indexer Consumption by End-Users from 2014 to 2026
-
Table Asia Pacific Rotary Indexer Consumption Share by End-Users from 2014 to 2026
-
Figure Asia Pacific Rotary Indexer Consumption Share by End-Users in 2014
-
Figure Asia Pacific Rotary Indexer Consumption Share by End-Users in 2018
-
Figure Asia Pacific Rotary Indexer Consumption Share by End-Users in 2026
-
Table Asia Pacific Rotary Indexer Consumption by Major Countries from 2014 to 2026
-
Table Asia Pacific Rotary Indexer Consumption Share by Major Countries from 2014 to 2026
-
Figure Asia Pacific Rotary Indexer Consumption Share by Major Countries in 2014
-
Figure Asia Pacific Rotary Indexer Consumption Share by Major Countries in 2018
-
Figure Asia Pacific Rotary Indexer Consumption Share by Major Countries in 2026
-
Figure China Rotary Indexer Market Volume and Growth Rate from 2014 to 2026
-
Figure Japan Rotary Indexer Market Volume and Growth Rate from 2014 to 2026
-
Figure Australia and New ZealandRotary Indexer Market Volume and Growth Rate from 2014 to 2026
-
Figure India Rotary Indexer Market Volume and Growth Rate from 2014 to 2026
-
Figure ASEAN Countries Rotary Indexer Market Volume and Growth Rate from 2014 to 2026
-
Figure South Korea Rotary Indexer Market Volume and Growth Rate from 2014 to 2026
-
Table Latin America, Middle East & Africa Rotary Indexer Consumption by Types from 2014 to 2026
-
Table Latin America, Middle East & Africa Rotary Indexer Consumption Share by Types from 2014 to 2026
-
Figure Latin America, Middle East & Africa Rotary Indexer Consumption Share by Types in 2014
-
Figure Latin America, Middle East & Africa Rotary Indexer Consumption Share by Types in 2018
-
Figure Latin America, Middle East & Africa Rotary Indexer Consumption Share by Types in 2026
-
Table Latin America, Middle East & Africa Rotary Indexer Consumption by End-Users from 2014 to 2026
-
Table Latin America, Middle East & Africa Rotary Indexer Consumption Share by End-Users from 2014 to 2026
-
Figure Latin America, Middle East & Africa Rotary Indexer Consumption Share by End-Users in 2014
-
Figure Latin America, Middle East & Africa Rotary Indexer Consumption Share by End-Users in 2018
-
Figure Latin America, Middle East & Africa Rotary Indexer Consumption Share by End-Users in 2026
-
Table Latin America, Middle East & Africa Rotary Indexer Consumption by Major Countries from 2014 to 2026
-
Table Latin America, Middle East & Africa Rotary Indexer Consumption Share by Major Countries from 2014 to 2026
-
Figure Latin America, Middle East & Africa Rotary Indexer Consumption Share by Major Countries in 2014
-
Figure Latin America, Middle East & Africa Rotary Indexer Consumption Share by Major Countries in 2018
-
Figure Latin America, Middle East & Africa Rotary Indexer Consumption Share by Major Countries in 2026
-
Figure GCC Countries Rotary Indexer Market Volume and Growth Rate from 2014 to 2026
-
Figure Brazil Rotary Indexer Market Volume and Growth Rate from 2014 to 2026
-
Figure Nigeria Rotary Indexer Market Volume and Growth Rate from 2014 to 2026
-
Figure South Africa Rotary Indexer Market Volume and Growth Rate from 2014 to 2026
-
Figure Argentina Rotary Indexer Market Volume and Growth Rate from 2014 to 2026
-
Table Company Profile and Development Status of Weiss
-
Table Sales, Revenue, Sales Price and Gross Margin Analysis of Weiss
-
Figure Sales and Growth Rate Analysis of Weiss
-
Figure Revenue and Market Share Analysis of Weiss
-
Table Product and Service Introduction of Weiss
-
Table Company Profile and Development Status of DE-STA-CO
-
Table Sales, Revenue, Sales Price and Gross Margin Analysis of DE-STA-CO
-
Figure Sales and Growth Rate Analysis of DE-STA-CO
-
Figure Revenue and Market Share Analysis of DE-STA-CO
-
Table Product and Service Introduction of DE-STA-CO
-
Table Company Profile and Development Status of Sankyo
-
Table Sales, Revenue, Sales Price and Gross Margin Analysis of Sankyo
-
Figure Sales and Growth Rate Analysis of Sankyo
-
Figure Revenue and Market Share Analysis of Sankyo
-
Table Product and Service Introduction of Sankyo
-
Table Company Profile and Development Status of CDS
-
Table Sales, Revenue, Sales Price and Gross Margin Analysis of CDS
-
Figure Sales and Growth Rate Analysis of CDS
-
Figure Revenue and Market Share Analysis of CDS
-
Table Product and Service Introduction of CDS
-
Table Company Profile and Development Status of TanTzu
-
Table Sales, Revenue, Sales Price and Gross Margin Analysis of TanTzu
-
Figure Sales and Growth Rate Analysis of TanTzu
-
Figure Revenue and Market Share Analysis of TanTzu
-
Table Product and Service Introduction of TanTzu
-
Table Company Profile and Development Status of DEX
-
Table Sales, Revenue, Sales Price and Gross Margin Analysis of DEX
-
Figure Sales and Growth Rate Analysis of DEX
-
Figure Revenue and Market Share Analysis of DEX
-
Table Product and Service Introduction of DEX
-
Table Company Profile and Development Status of Handex
-
Table Sales, Revenue, Sales Price and Gross Margin Analysis of Handex
-
Figure Sales and Growth Rate Analysis of Handex
-
Figure Revenue and Market Share Analysis of Handex
-
Table Product and Service Introduction of Handex
-
Table Company Profile and Development Status of ZZ-ANTRIEBE
-
Table Sales, Revenue, Sales Price and Gross Margin Analysis of ZZ-ANTRIEBE
-
Figure Sales and Growth Rate Analysis of ZZ-ANTRIEBE
-
Figure Revenue and Market Share Analysis of ZZ-ANTRIEBE
-
Table Product and Service Introduction of ZZ-ANTRIEBE
-
Table Company Profile and Development Status of Camdex
-
Table Sales, Revenue, Sales Price and Gross Margin Analysis of Camdex
-
Figure Sales and Growth Rate Analysis of Camdex
-
Figure Revenue and Market Share Analysis of Camdex
-
Table Product and Service Introduction of Camdex
-
Table Company Profile and Development Status of GSD Cam
-
Table Sales, Revenue, Sales Price and Gross Margin Analysis of GSD Cam
-
Figure Sales and Growth Rate Analysis of GSD Cam
-
Figure Revenue and Market Share Analysis of GSD Cam
-
Table Product and Service Introduction of GSD Cam
-
Table Company Profile and Development Status of ENTRUST
-
Table Sales, Revenue, Sales Price and Gross Margin Analysis of ENTRUST
-
Figure Sales and Growth Rate Analysis of ENTRUST
-
Figure Revenue and Market Share Analysis of ENTRUST
-
Table Product and Service Introduction of ENTRUST
-
Table Company Profile and Development Status of CKD
-
Table Sales, Revenue, Sales Price and Gross Margin Analysis of CKD
-
Figure Sales and Growth Rate Analysis of CKD
-
Figure Revenue and Market Share Analysis of CKD
-
Table Product and Service Introduction of CKD
-
Table Company Profile and Development Status of Taktomat
-
Table Sales, Revenue, Sales Price and Gross Margin Analysis of Taktomat
-
Figure Sales and Growth Rate Analysis of Taktomat
-
Figure Revenue and Market Share Analysis of Taktomat
-
Table Product and Service Introduction of Taktomat
-
Table Company Profile and Development Status of SOPAP Automation
-
Table Sales, Revenue, Sales Price and Gross Margin Analysis of SOPAP Automation
-
Figure Sales and Growth Rate Analysis of SOPAP Automation
-
Figure Revenue and Market Share Analysis of SOPAP Automation
-
Table Product and Service Introduction of SOPAP Automation
-
Table Company Profile and Development Status of OGP
-
Table Sales, Revenue, Sales Price and Gross Margin Analysis of OGP
-
Figure Sales and Growth Rate Analysis of OGP
-
Figure Revenue and Market Share Analysis of OGP
-
Table Product and Service Introduction of OGP
-
Table Company Profile and Development Status of Colombo Filippetti
-
Table Sales, Revenue, Sales Price and Gross Margin Analysis of Colombo Filippetti
-
Figure Sales and Growth Rate Analysis of Colombo Filippetti
-
Figure Revenue and Market Share Analysis of Colombo Filippetti
-
Table Product and Service Introduction of Colombo Filippetti
-
Table Company Profile and Development Status of Kamoseiko
-
Table Sales, Revenue, Sales Price and Gross Margin Analysis of Kamoseiko
-
Figure Sales and Growth Rate Analysis of Kamoseiko
-
Figure Revenue and Market Share Analysis of Kamoseiko
-
Table Product and Service Introduction of Kamoseiko
-
Table Company Profile and Development Status of RNA
-
Table Sales, Revenue, Sales Price and Gross Margin Analysis of RNA
-
Figure Sales and Growth Rate Analysis of RNA
-
Figure Revenue and Market Share Analysis of RNA
-
Table Product and Service Introduction of RNA
-
Table Company Profile and Development Status of Shandong Hongbang
-
Table Sales, Revenue, Sales Price and Gross Margin Analysis of Shandong Hongbang
-
Figure Sales and Growth Rate Analysis of Shandong Hongbang
-
Figure Revenue and Market Share Analysis of Shandong Hongbang
-
Table Product and Service Introduction of Shandong Hongbang
-
Table Company Profile and Development Status of AUTOROTOR
-
Table Sales, Revenue, Sales Price and Gross Margin Analysis of AUTOROTOR
-
Figure Sales and Growth Rate Analysis of AUTOROTOR
-
Figure Revenue and Market Share Analysis of AUTOROTOR
-
Table Product and Service Introduction of AUTOROTOR
-
Table Company Profile and Development Status of Huachi Cam
-
Table Sales, Revenue, Sales Price and Gross Margin Analysis of Huachi Cam
-
Figure Sales and Growth Rate Analysis of Huachi Cam
-
Figure Revenue and Market Share Analysis of Huachi Cam
-
Table Product and Service Introduction of Huachi Cam
-
Table Company Profile and Development Status of Furuta
-
Table Sales, Revenue, Sales Price and Gross Margin Analysis of Furuta
-
Figure Sales and Growth Rate Analysis of Furuta
-
Figure Revenue and Market Share Analysis of Furuta
-
Table Product and Service Introduction of Furuta
-
Table Company Profile and Development Status of ITALPLANT
-
Table Sales, Revenue, Sales Price and Gross Margin Analysis of ITALPLANT
-
Figure Sales and Growth Rate Analysis of ITALPLANT
-
Figure Revenue and Market Share Analysis of ITALPLANT
-
Table Product and Service Introduction of ITALPLANT
-